1. var bob = new Person();
2. bob.sayHello();
3. bob.wave();
##################################################################################################################
Revolutionising environmental impact tracking with real-time data delivered to your desk!
How I architected, designed and built a system that calculates the CO2 savings of all the zero emission vehicles financed through the Zeti platform, and sends that to both a dashboard and a ticker device that can sit on your desk
##################################################################################################################
4. var cup = new Coffee();
5. bob.drink(cup);
6. var cupTwo = new Coffee();
In my new role at Zeti, the big environmental mission we are targeting is reducing the CO2 and air pollution of transport. CO2 is responsible for climate change, and air pollution kills thousands of people in the UK every year. One of the major gases in air pollution is NOx, or Nitrogen Oxides. Zeti reduces this by getting clean transport on the road instead of polluting transport through an innovative pay-as-you-use financing model that fleet operators love which uses IoT devices to track vehicles. Want to find out more about Zeti? Find us at zeti.co.uk
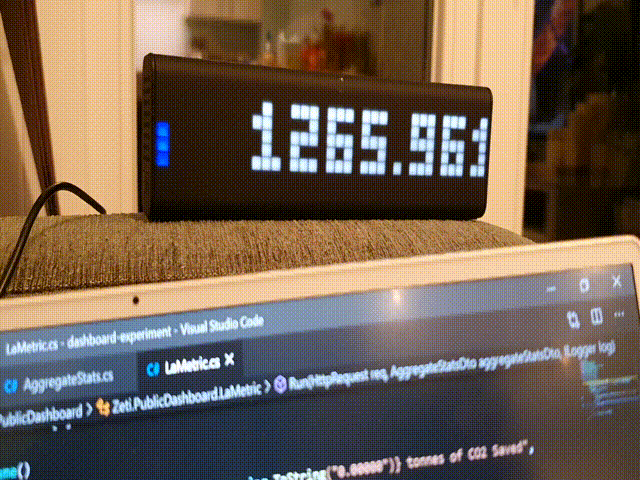
To show these savings I’ve created a live ticker our carbon impact using an LaMetric Time device:
I’ve also created a website that you can visit here.

This device offers an unparalleled level of transparency and speed for environmental reporting for a financial company, and showcases what we can offer to individual investors. For any investor who funds Zeti vehicles, they will receive some devices like these and see the key information on their investment in realtime - starting with environmental data but also expanding to include the effective interest rate of their investment and other KPI’s. Zeti will also naturally offer this information over a secure API for investors to pull into their own systems (of course lower frequency options will be available!).
I was able to go from idea to a working production deployment of this service in less than 2 days. That isn’t a brag about how wonderful a developer I am, but yet another recourse to my favourite topic - how effective Serverless technology is at speeding up your delivery cycle. I had never used two of the services that I used to build this, but because the barrier to entry is so low with Serverless services I could get started and work things out very quickly. The service is also quite scalable, I am confident as we scale Zeti up and deploy thousands of vehicles this codebase will not need to be modified significantly (quote that back to me after our first outage).
How did I build the website?
I already had a system which forms the backbone of Zeti’s data architecture, currently imaginatively called the ‘Vehicle Service’. It consists of a C# Linux Azure Function and a Cosmos DB account set into serverless mode. It ingests data from various telematics suppliers in real time, generally around every 5 seconds, and reshapes the various data points into Zeti’s internal data structure. This data can be fantastically detailed about the exact state of the vehicle at that moment, from their GPS and mileage to their battery charge level. Initially all it did then was respond to request for that data from other systems - it didn’t do anything to tell any other system that ‘hey! I’ve just received an update’.
The first thing I knew I’d have to do to make a system like this work the way it should is flip around the vehicle service so that rather than always waiting for requests it emitted events whenever it got some new data from a vehicle. I did some evaluation, and concluded that Azure Event Grid was probably ideal for me. Serverless operation, massive scale, easy to set up and operate event service. A few simple lines of code later and now every time the vehicle service received new data it executed a SQL query on the cosmos db that converted that data into our aggregate stats on CO2 and NOx savings for the entire fleet and pinged that to an Event Grid topic. The nice thing about event systems is that the Vehicle Service doesn’t know or care who, if anyone, is listening on that Event Grid Topic - it is fire and forget from its point of view.
So now we’ve a stream of events flowing from a vehicle service, but how do we put up a webpage that will display them? In terms of Azure tools for spinning up a simple website quickly, nothing is quite as effective as Azure Static App Service. I use GitHub actions for our CI/CD anyway, so it was the work of minutes to have a Next.js web app deployed to the static app service. The idea was this React app (Next.js is a React framework, so I’ll refer to it as React) would then receive pushes over websockets when these events arrived.
Event Grid didn’t seem really appropriate as a tool to try and deliver events to a browser - it was far more for server based applications. Azure SignalR Service is far more suited to pushing events to the browser. I don’t necessarily understand all of it, but from what I could remember Signalr was a protocol or service that sort of gracefully handled all aspects of getting real time events into browsers - so if websockets didn’t work it would fall back to something else etc. This is exactly the sort of thing I need to make my service be a push rather than a poll (i.e. rather than my react app calling my backend every 5 seconds to check if there’s more data, it sits there and waits for a ‘push’ from the server).
But how to connect the two? Event Grid can’t output directly to SignalR, and anyway we may well want some caching and retry logic in between the two to handle small outages gracefully. Naturally I chose to use a Serverless function, with an input binding for Event Grid and an output binding for SignalR as well as another output binding that cached the latest message in table storage - this was specifically for the LaMetric, but having that cached value can be useful as a fallback for if the entire realtime stream falls over:

So now I’d successfully got a system which retrieved and aggregated vehicle data from our fleet, sent an event with the aggregate information on it to an Azure Function, which then passed it on to a SignalR Service and then in theory on to users browsers. But how does the browser connect to this SignalR service?
You’ll notice in the figure above a very short function called negotiate. Essentially the front end sends a request to this to get the connection details for the SignalR instance, uses those to connect to SignalR and then the browser and SignalR work out the best way for them to talk to one another. This all sounds complicated, but the front end code is quite simple because the SignalR library handles the worst of it. Essentially you just register a function that listens for events with the same name that you gave the event in the backend.

Simply change out that .azurewebsites.net address to your own function app, and under the hood it adds /negotiate on the end of whatever you put. As you can see, I’ve registered a callback function for when ‘NewAggregateStatsMessage’ events arrive and take the data out of the event and display it.
This works really nicely. Some points on scalability/pricing - almost all of these components are that common thing I like - cheap, fast and serverless. The Azure SignalR Service is not. There’s a free instance which will support upto 20 simultaneous connections (this is a lot more than it sounds for small sites that aren’t going to have sustained usage like this sort of splash page - how often realistically are there going to be more than 20 people on this site at once?). Then you start going into monthly payments in increments of £36 per month per 1000 connections, with no automated scaling between units (i.e. you have to up it to the £72 a month plan manually). It is disappointing, because the actual service is fantastic - fast, easy to use and deploy, and simple to support. I could cut this out and simply make the React app poll the backend every 5 seconds - and in fact I may have to - but that would be a shame as it reduces the ‘live’ nature of the data.
How did I build the LaMetric ticker?
Almost as soon as I’d finished the website, the doorbell rang and the LaMetric was delivered. LaMetric is a smart clock, which you can install custom apps on via their app store. It is quite easy to add your own app to the store, and use that to display data from any given web endpoint. LaMetric has a developer portal that had similarities in my mind to the Slack one - an ‘App’ is basically just some metadata and an address for the app to call to get data from every x number of seconds. You can choose a number of frames, which the LaMetric then automatically loops between. Your endpoint provides the values to go in those frames, including a code for the icon to display.

So all that remains is to supply add an Azure Function to supply these ‘frames’ for the LaMetric every time it requests them. I added a new function that basically reads out the cached value stored in the Table Storage above and maps it to the format needed for the LaMetric:

This solution then works straight away - nice and easy. To make this easy to read I spread it over a few lines, but there’s really about 2 lines of actual logic here. I could then use this exact same technique to replace the SignalR solution/provide a backup API that the frontend can call if the SignalR service is overloaded.
The Result
We now have a nice, easy to roll out, physical experience of our CO2 and NOx emissions. I’ve currently got this ticker running next to me every day and it works as great motivation! I think it’s a surprisingly easy way to achieve this cool result, albeit quite expensive at £170 for a LaMetric unit. There doesn’t appear to be a significantly cheaper alternative that offers the ability to load custom apps so easily, please do get in touch if you know of any!
I think you could use this for a range of things, Troy Hunt uses his for monitoring the subscriber count on haveibeenpwned - anything where you can have a key KPI that changes in real time is suitable I think. I was inspired partly by his article, and I think this app is a decent example of to do the same/a similar thing whilst staying inside Azure.
If you’ve any questions, suggestions or want to find out more about technology at Zeti, drop me an email at danbass@zeti.co.uk
© 2022 - Built by Daniel Bass